Initiative Visibility App
The EEAAO Dashboard is a centralized reporting platform built to give IBM Technology Sales leadership real-time visibility into key initiatives driving growth, productivity, and revenue. Designed and developed end-to-end using React, Node.js, and MongoDB, the dashboard consolidates complex data sources into a cohesive, interactive interface that aligns day-to-day activities with IBM’s high-level strategic priorities.
Timeline: 4 Months
Role: Lead Designer & Lead Developer
Problem
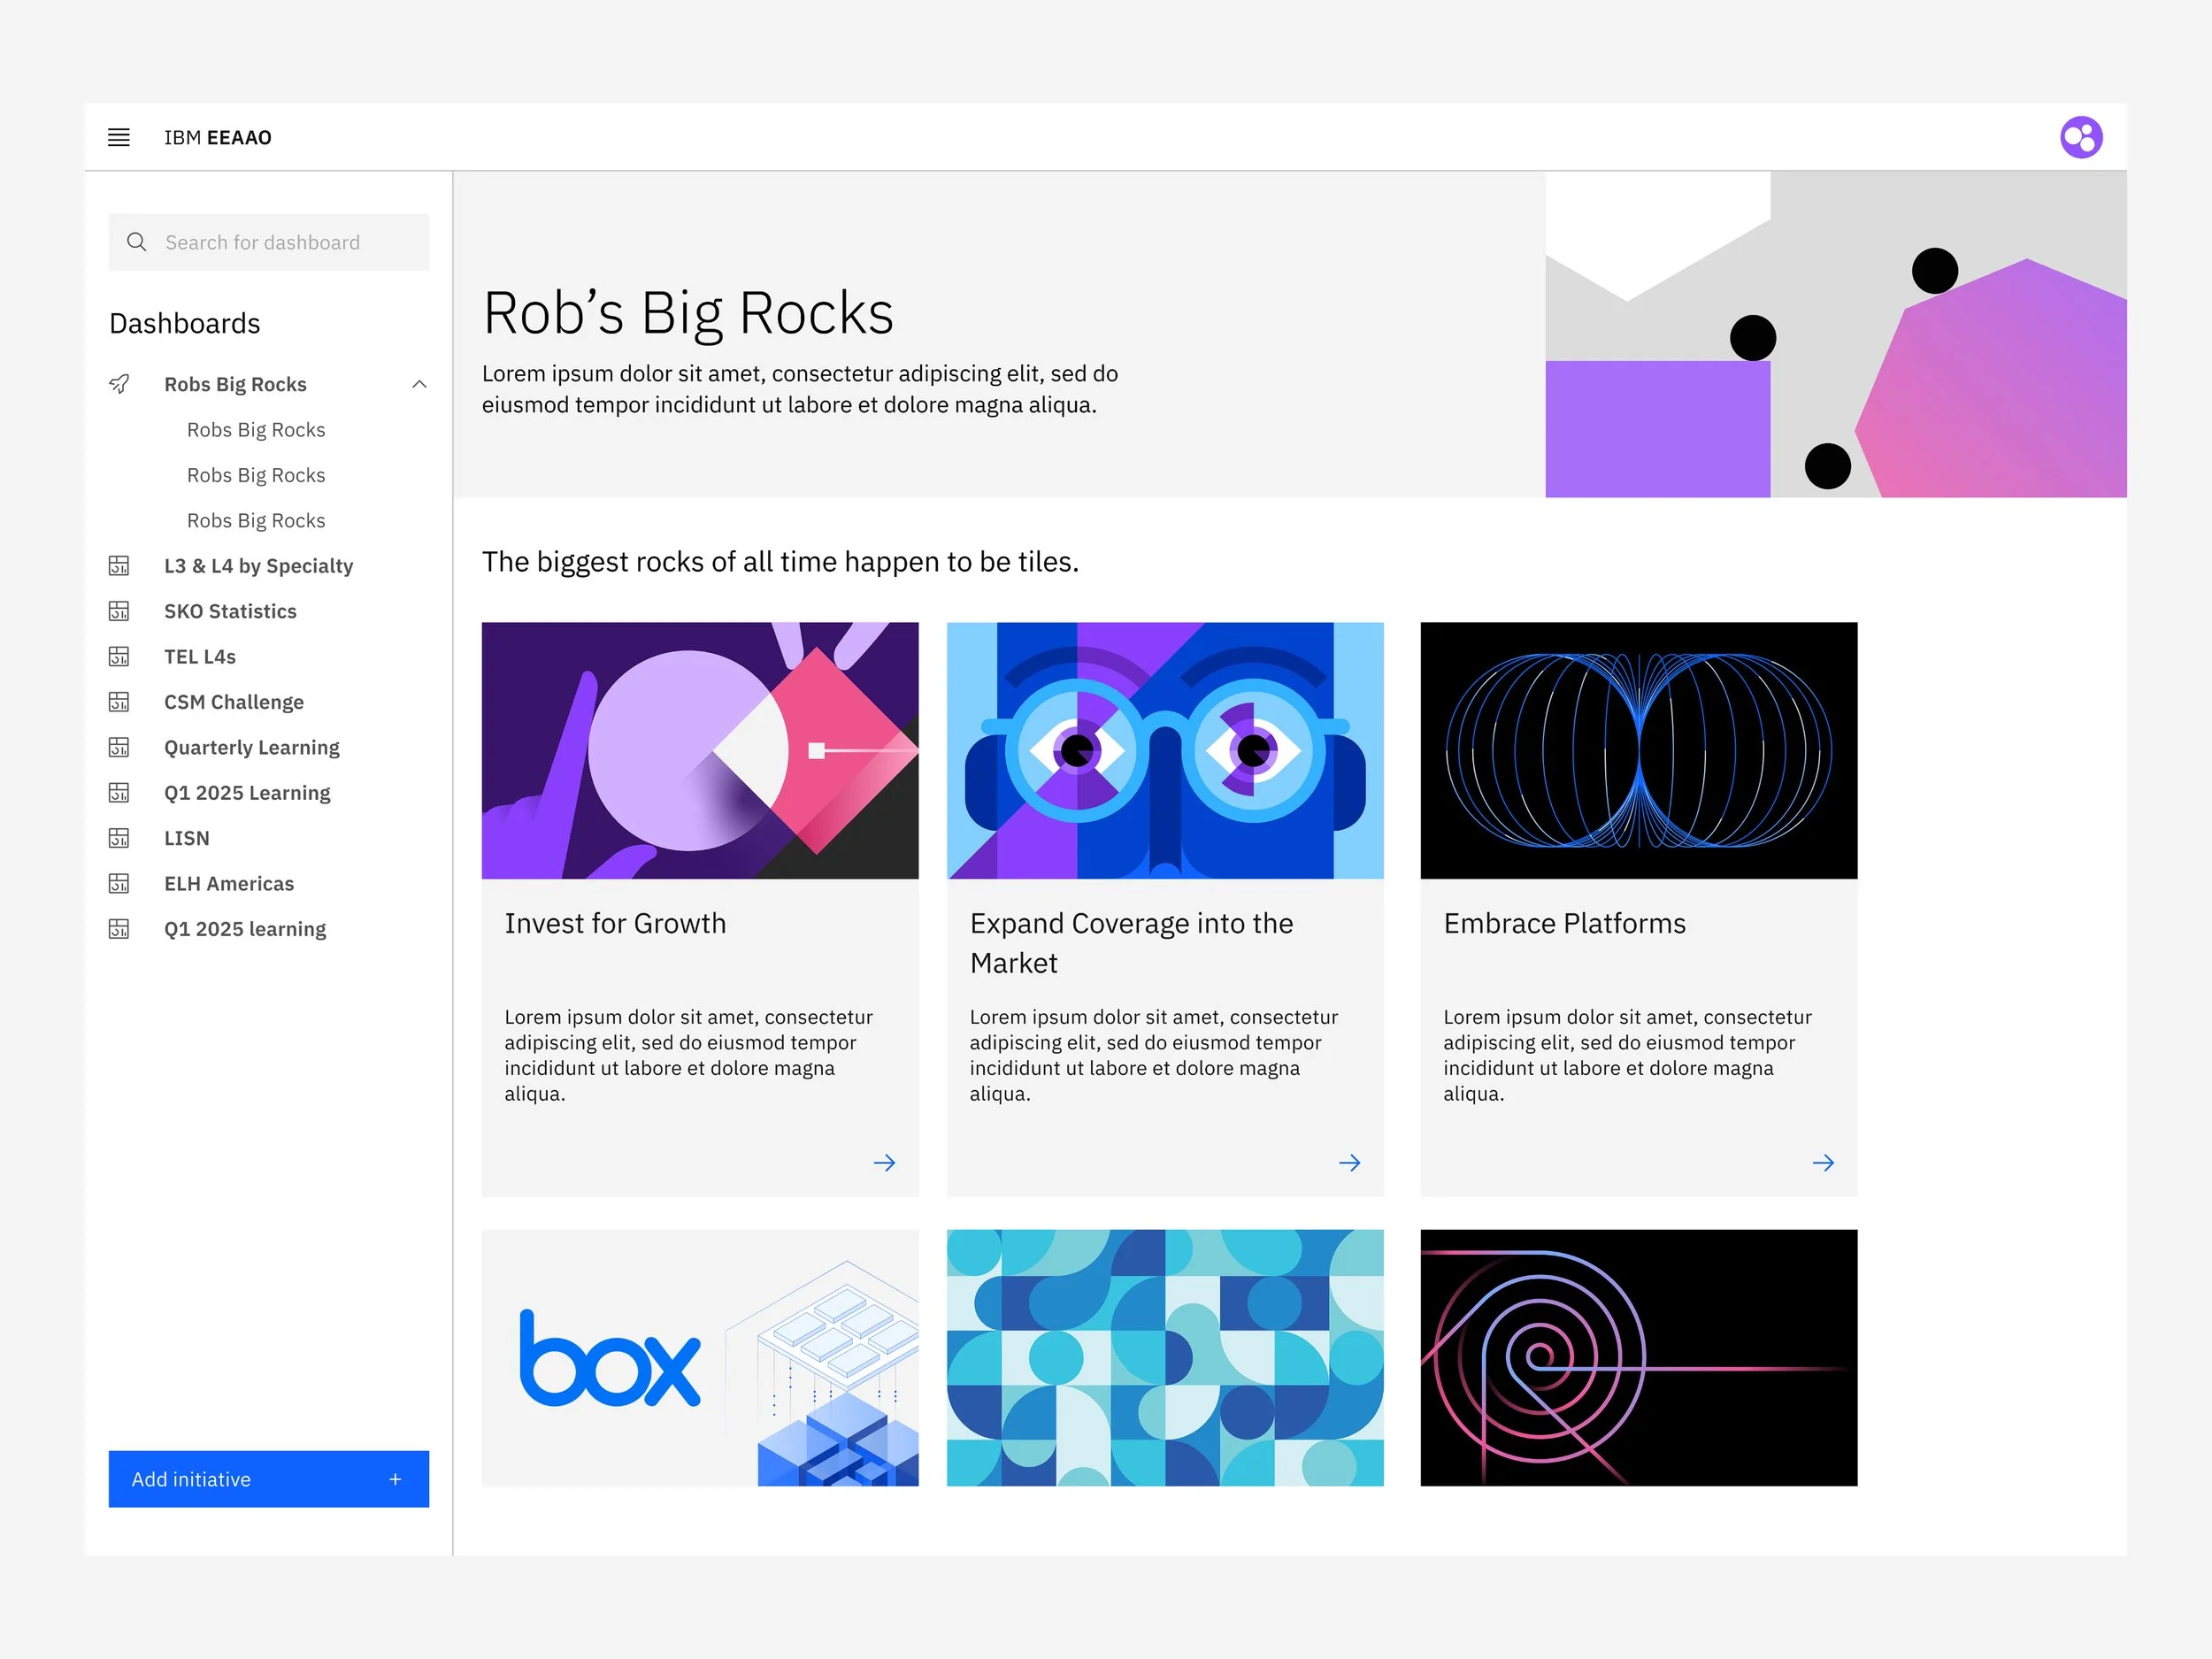
IBM Technology Sales leadership needed a clear, unified view of progress across strategic “big rock” initiatives — Invest for Growth, Expand Coverage, and Embrace Platforms. Data was scattered across multiple systems (Cognos, Seismic, and Datamyte), making it difficult to measure impact, track dependencies, or prioritize efforts effectively. Without a centralized view, leadership lacked the visibility needed to make timely, data-driven decisions that aligned with overall business goals.
Solution
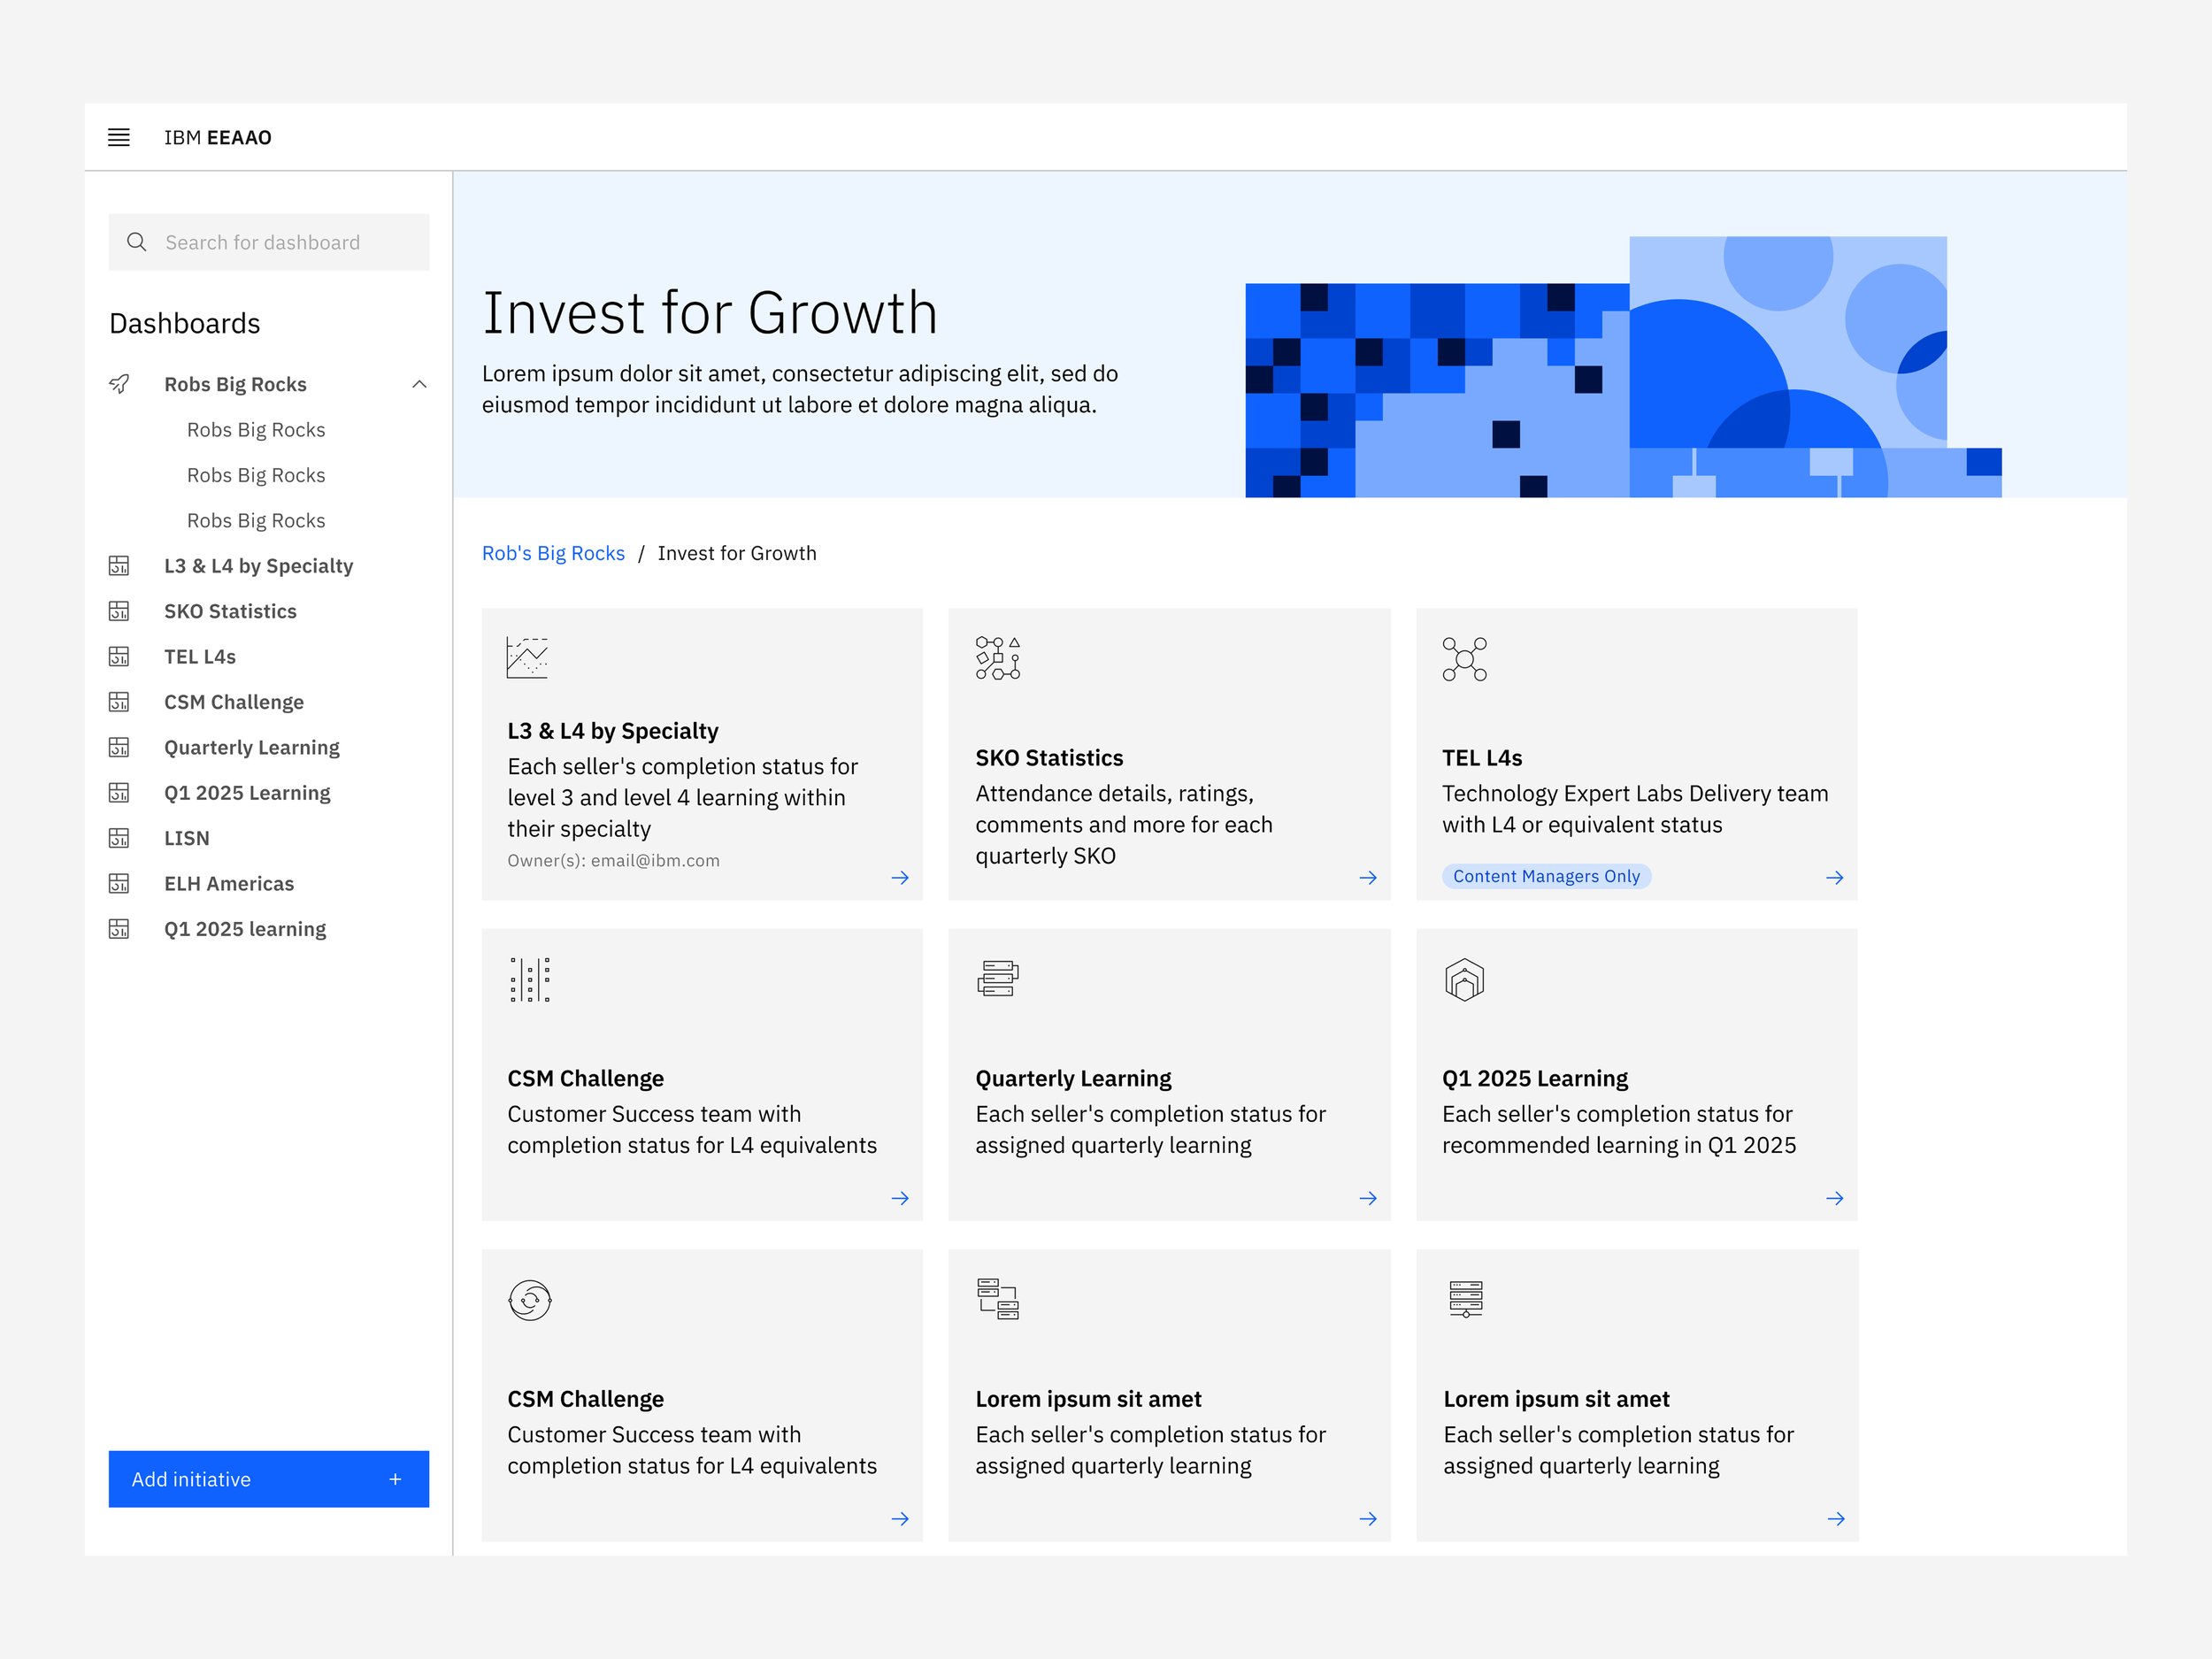
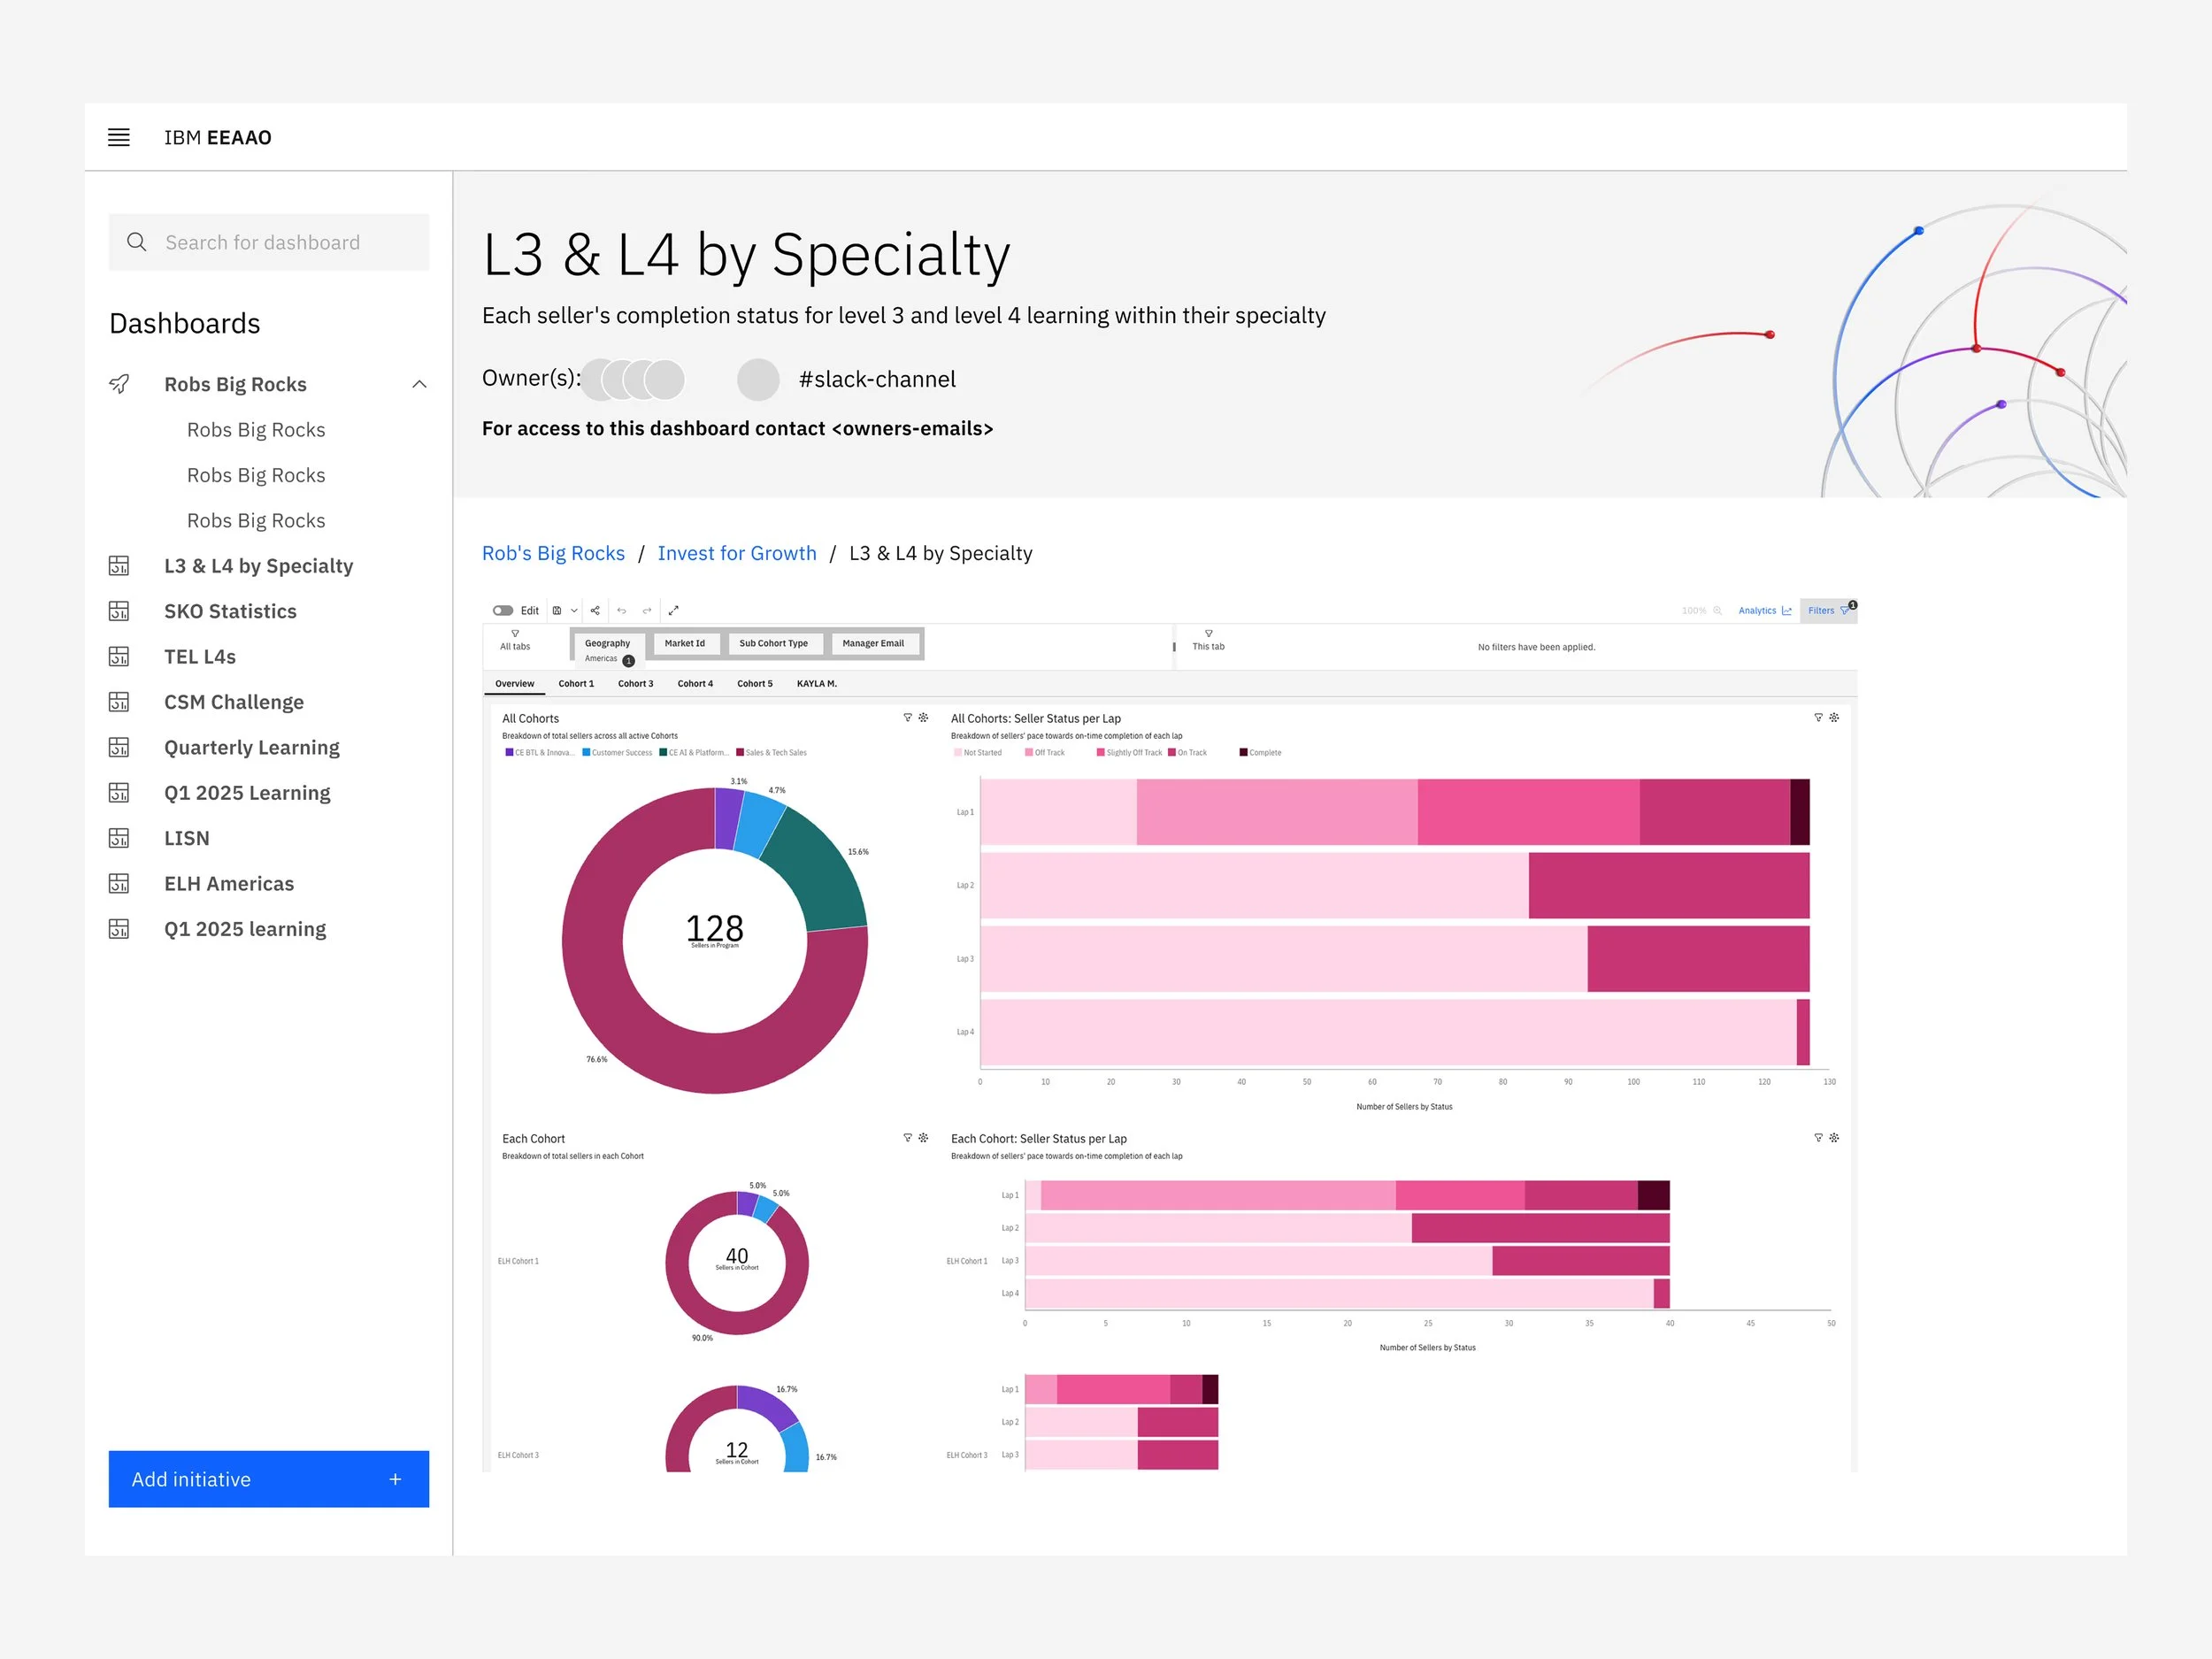
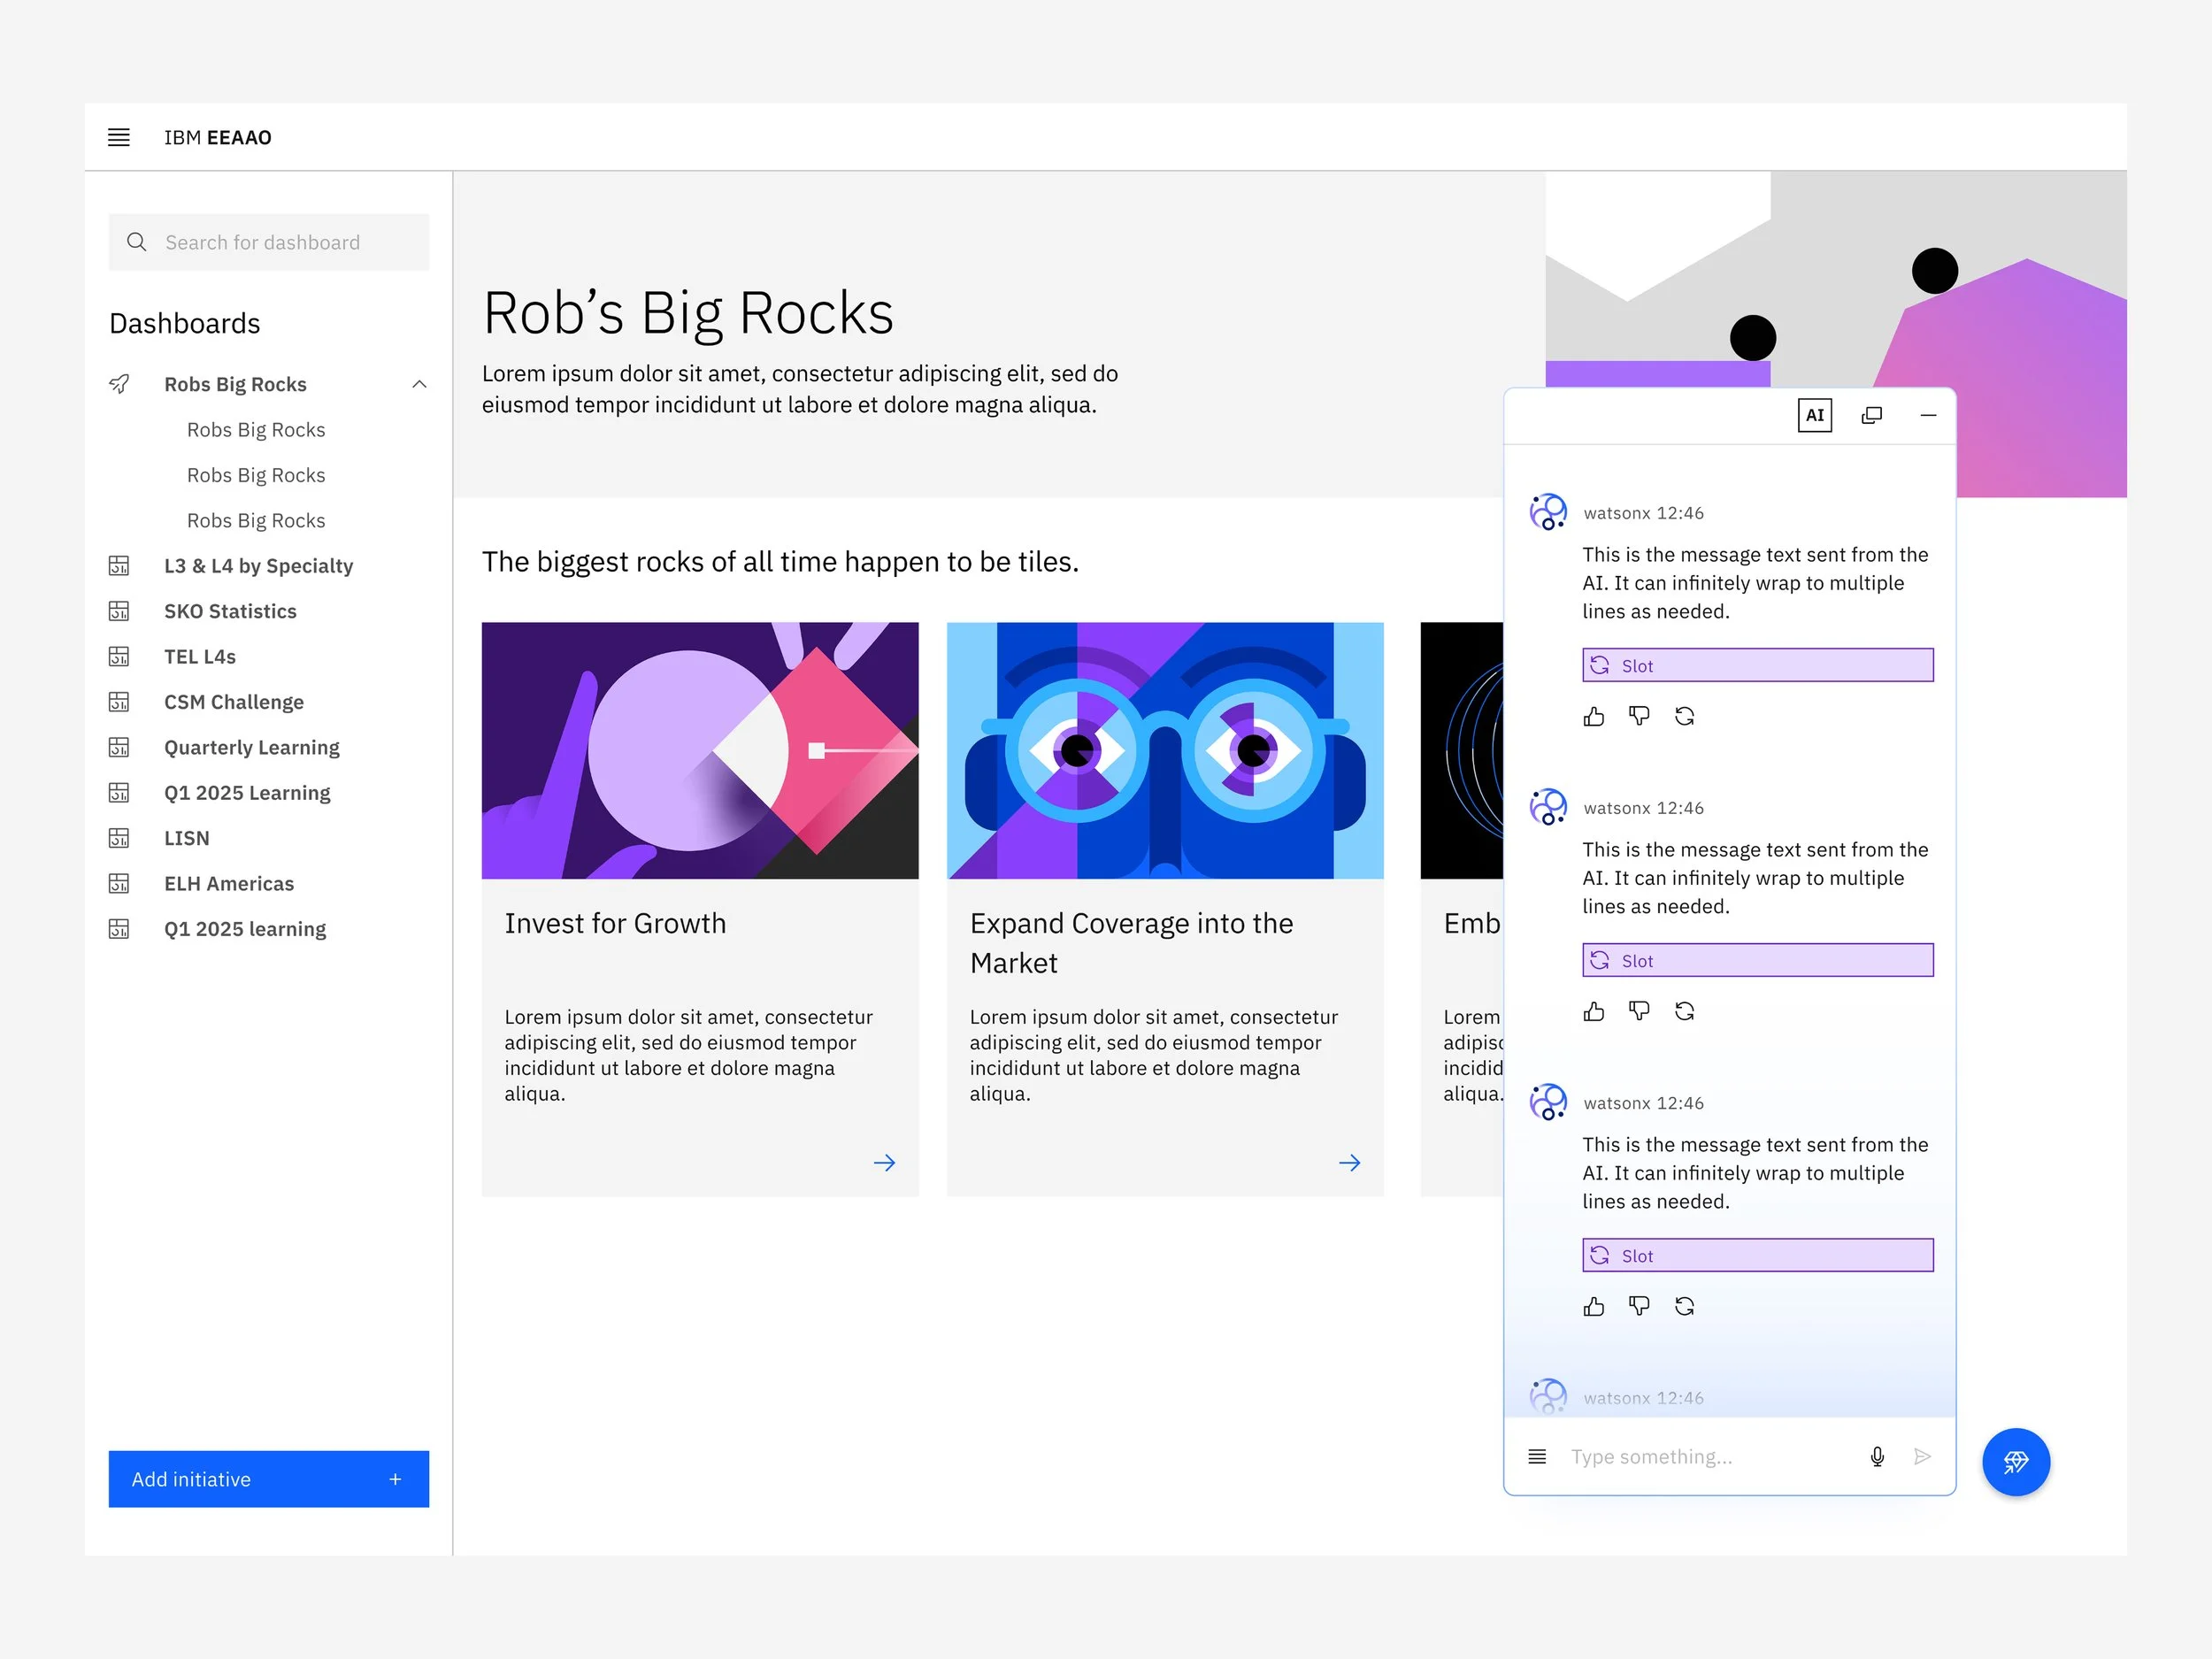
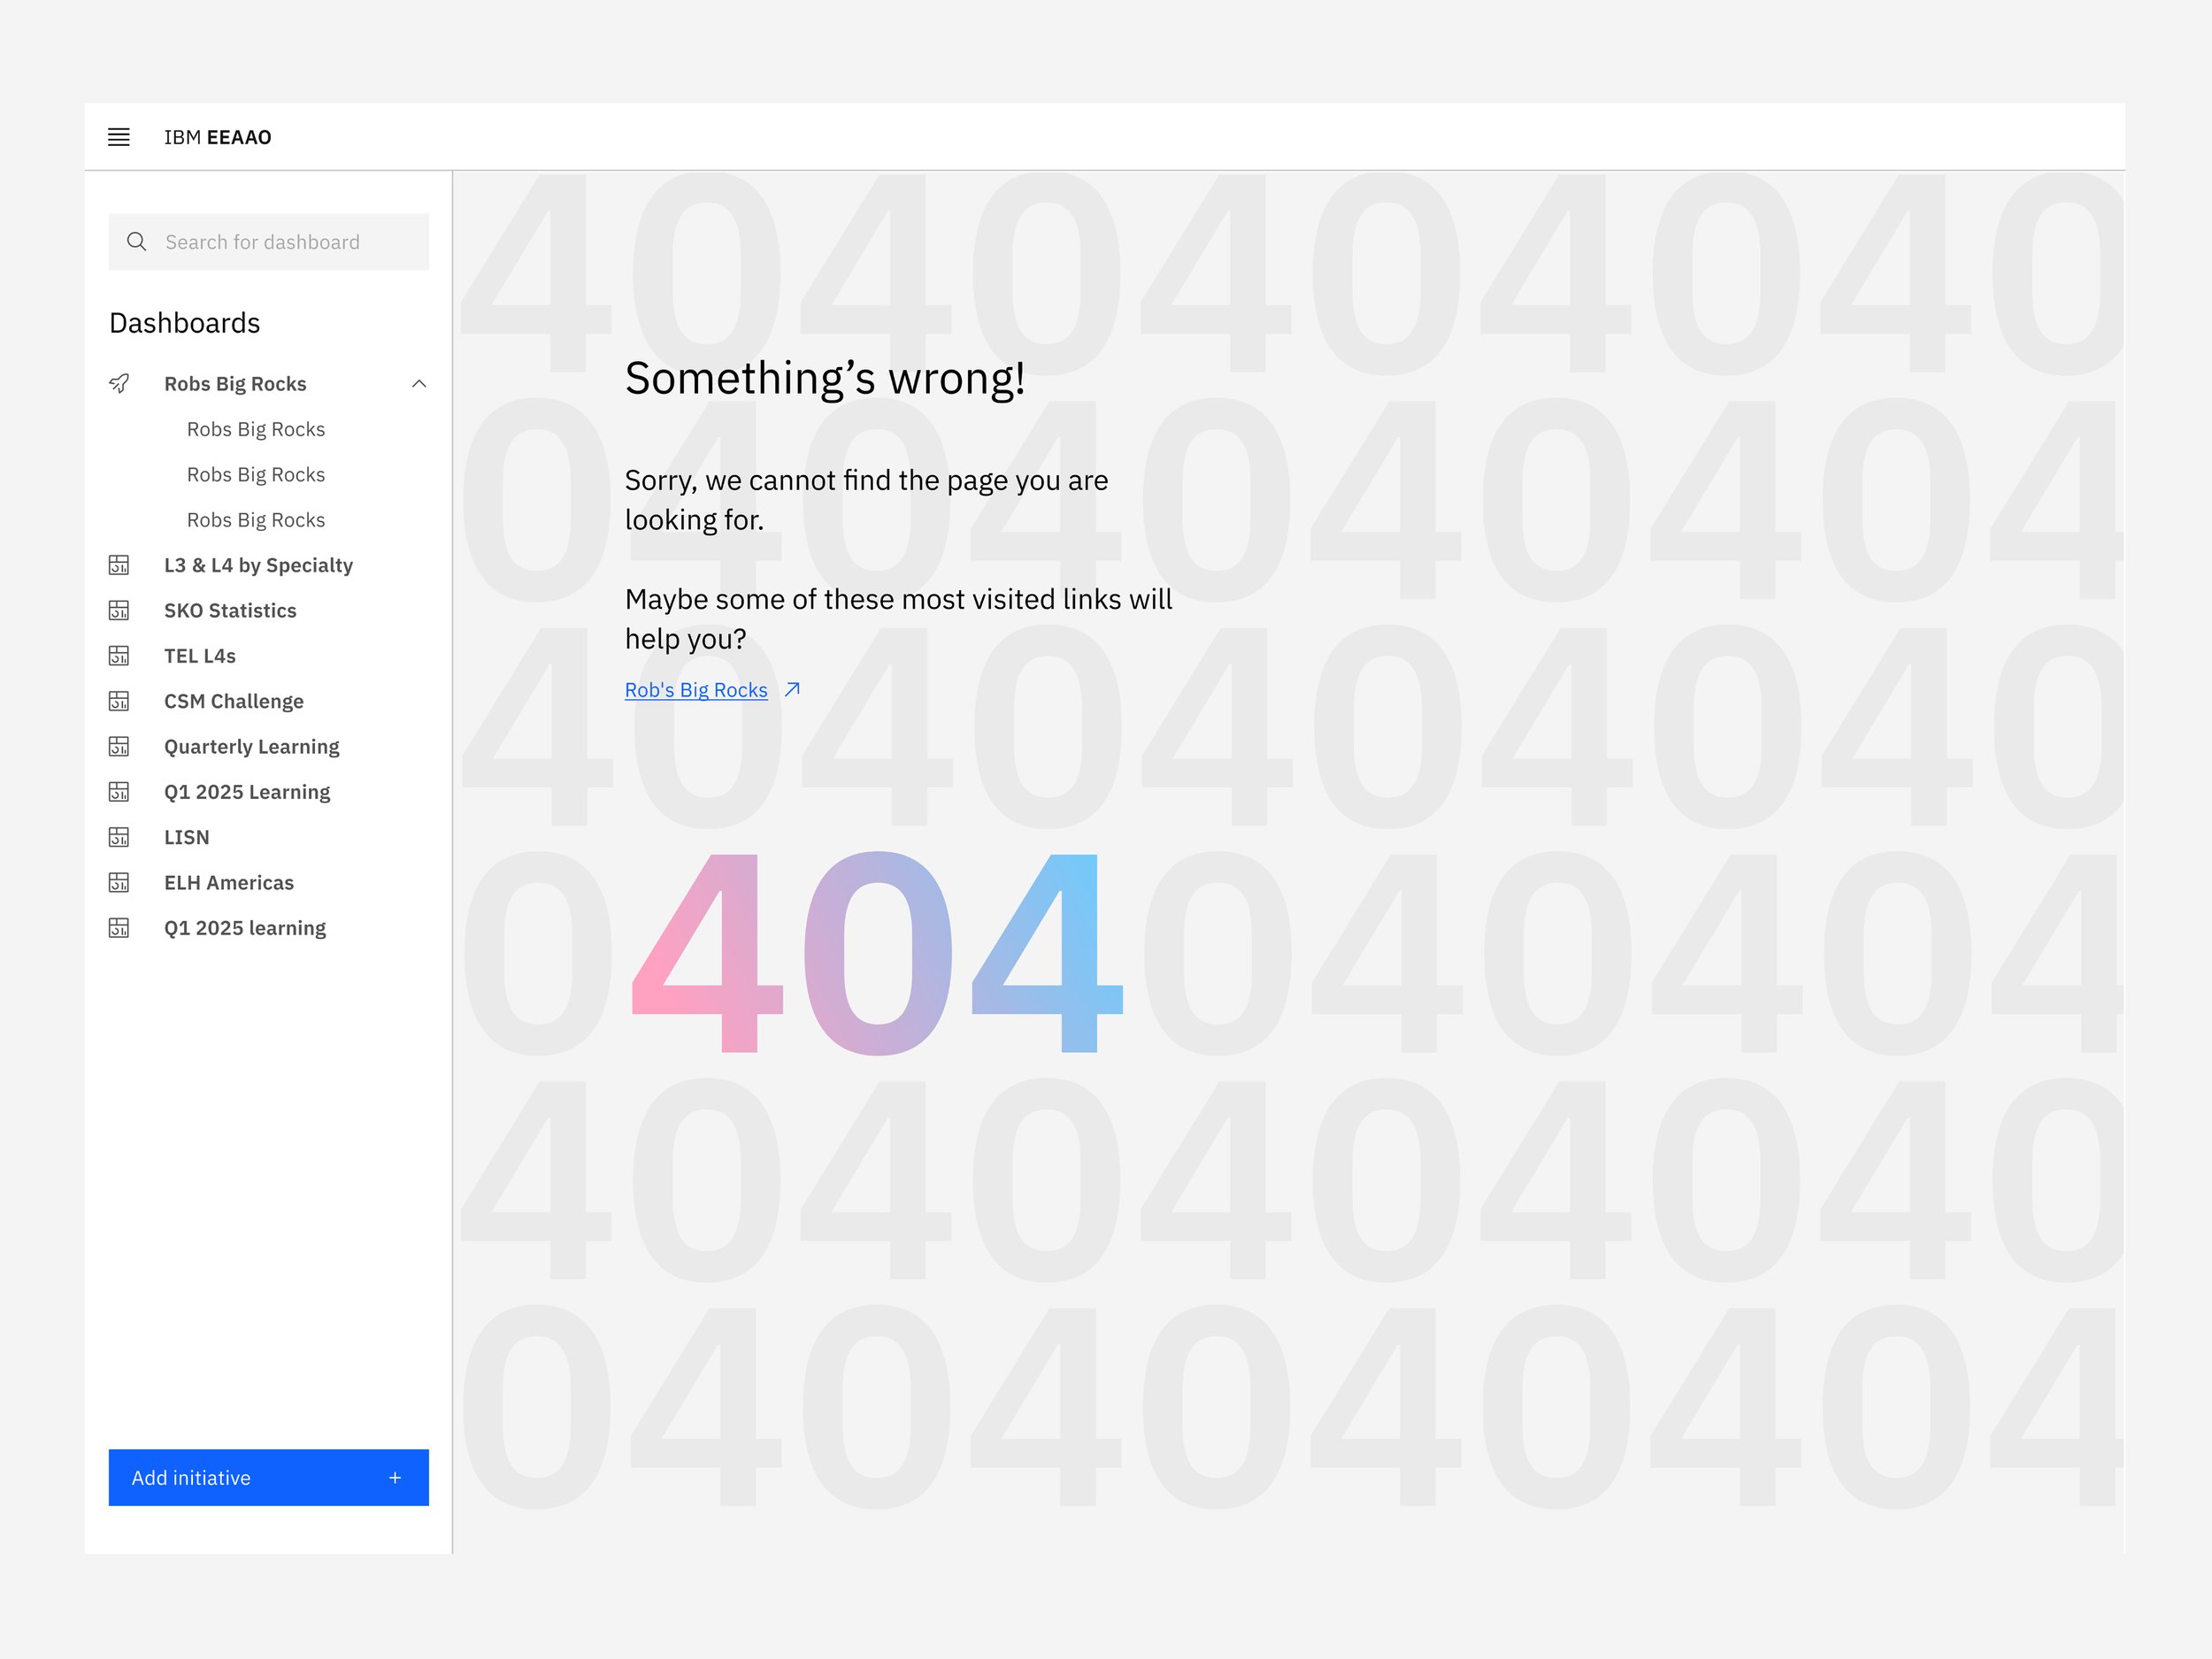
As the sole developer and technical lead, I designed, built, and deployed the EEAAO Dashboard over four months. The system aggregates data from multiple internal APIs, normalizes disparate formats, and presents them through a React interface powered by IBM Carbon Design components. The dashboard dynamically visualizes progress toward each strategic objective, providing real-time insight into sales productivity, skill growth, and revenue impact.
The EEAAO Dashboard consolidates data from multiple internal sources — including Seismic, Cognos, Datamyte, and IBM Box — into a unified, interactive interface. The system uses Node.js services to aggregate and normalize data, while dynamic React components render dashboards that adapt to changing metrics and layouts in real time. This architecture ensures high performance, secure data handling, and seamless scalability as new initiatives are added.